Thermal simulation provides more than an indication of operating temperatures. With it, insights can be gained into the physics of heat removal in a particular application as well as better decisions for a product’s thermal design.

Traditional electronics thermal management in high power applications such as telecommunication, networking, and computing involves keeping the operating junction temperatures at, or below, maximum rated values for the intended application, often with fans, blowers, heatsinks, etc. Mobile consumer electronics also have to be thermally managed to ensure that when a person uses the product, ‘touch temperatures’ do not exceed harmful, or at least uncomfortable, values.
In the following example, I’ll use a generic handheld device, let’s say a remote control (Figure 1, top cover removed for clarity), to show how thermal simulation can help us to determine the best cooling architecture for touch friendliness while indicating what the (maximum) power value could be under such conditions.
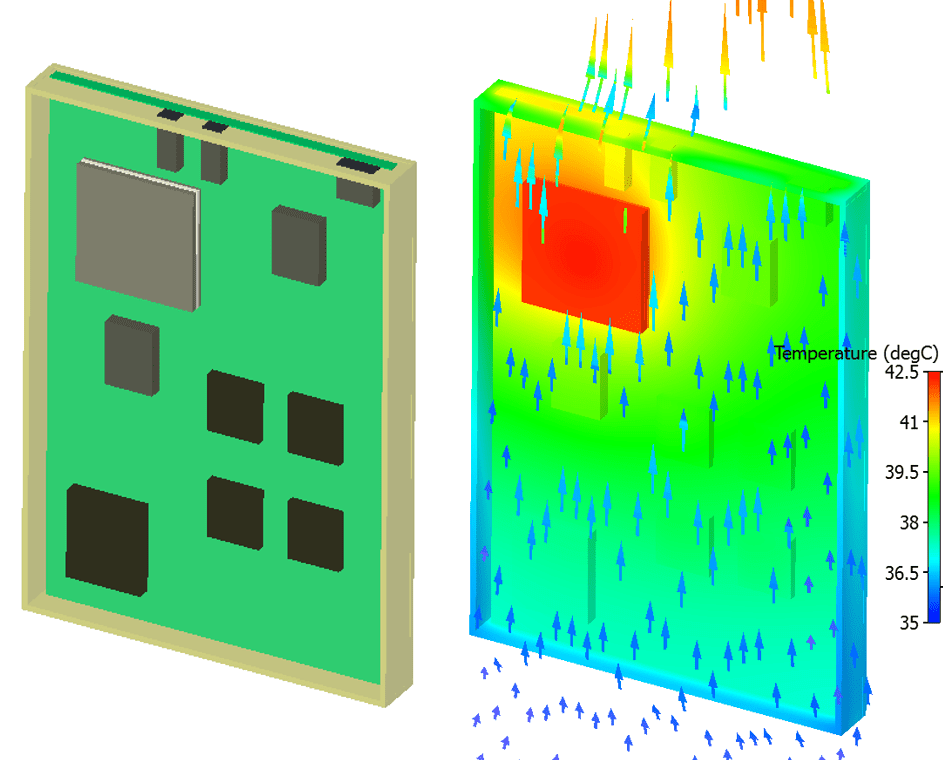
Figure 1. Temperature distributions in a generic handheld product.
This product is cooled by natural convection, where the air moves over it by buoyancy only. Using a CFD simulation tool such as FloTHERM, we can see the air flow and temperature variations in and around the product.
Thermal management involves the design of heat-flow paths that take the heat dissipated by an IC out of the product, as easily as possible, to the ambient environment. The more difficulties the heat flow has traversing this route, the greater the temperature rises will be.
For sealed systems such as this product, conduction is the primary method by which heat can move to the outer casing. If we introduce a direct conduction path between the IC and the casing, this heat-flow movement will be facilitated, resulting in substantial decreases in temperature rise. We could use thermal pads, but covering the inner face of the outer casing with a graphite-based spreader enables the heat to travel directly to the casing and, because of the spreader’s high in-plane thermal conductivity, spreads that heat across the inner face of the casing.

Figure 2. Cross section of the handheld product, with and without a graphite spreader.
A thermal simulation predicts not only the temperature variation but also provides insight into the heat-flow paths, so we can appreciate why the temperature distribution is what it is. Figure 3 shows both the temperature variation and heat-flux vectors on a plane through the main IC in the product. Without the spreader, most of the heat has to conduct back down toward the PCB, a tortuous path. The spreader enables the heat to travel out to the casing directly, where it then spreads right round, even to the back cover.

Figure 3. Temperature and heat flux distributions through the handheld product.
This product has no physical room for us to consider using a classic heatsink (which is better described as an area extender). The only surface area that is available to pass the heat onto the ambient is the cover. The spreader enables much better use of the available surface area, getting the heat to all corners of the casing where it can then be convected and radiated away.
What a personally acceptable touch temperature should be for such consumer products is somewhat subjective. This is also a function of the material that you are touching. This is why we do not put metal benches in a sauna! I was interested to learn that, from a psychological perspective, when we feel a hot spot, even if it is not that hot, we have a sense that something is wrong. Perhaps we naturally correlate a single (hot) spot to something that is malfunctioning.
For our product, let’s assume the maximum touch temperature is 41 °C (106 °F). We can then determine what power dissipation in both configurations (with and without a spreader) would achieve a maximum touch temperature at this value. This is easy to simulate. For illustration, I completed an optimization study, defined with a cost function (the parameter we intend to minimize), set to the maximum surface temperature minus 41. I allowed the power dissipation of the main IC to vary; then with a small number of simulations, I was able to hunt down what power would lead to a zero cost function. The results are shown in Figure 4.
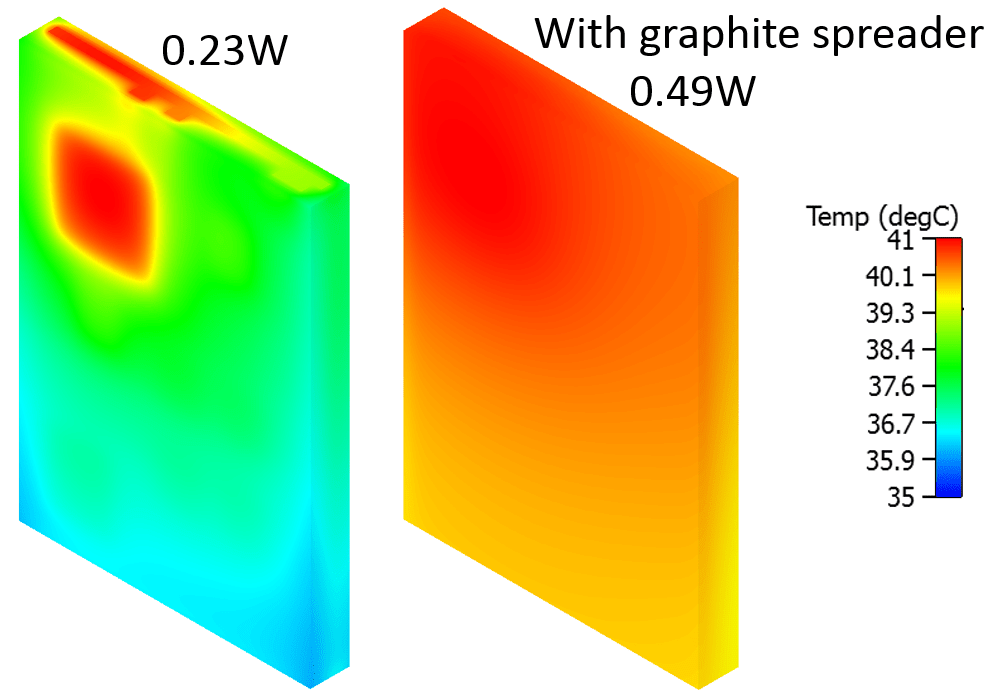
Figure 4. Surface temperature distributions and total power dissipation.
Not only is the surface temperature that much more uniform when we use a spreader, the power dissipation of the IC can be nearly twice what it could have been otherwise. This increase in permissible power results in more functionality that we can apply to the product.
As this example illustrates, thermal simulation provides us with more than just an indication of operating temperatures. With it, we can gain insights into the physics of heat removal in a particular application. This understanding translates into better decisions for the product’s thermal design.
 |
|
 |
 |
 |
 |
 |
 |
 |
 |
Leave a Reply