Semiconductor equipment and materials market and outlook.

Semiconductor Market Trends
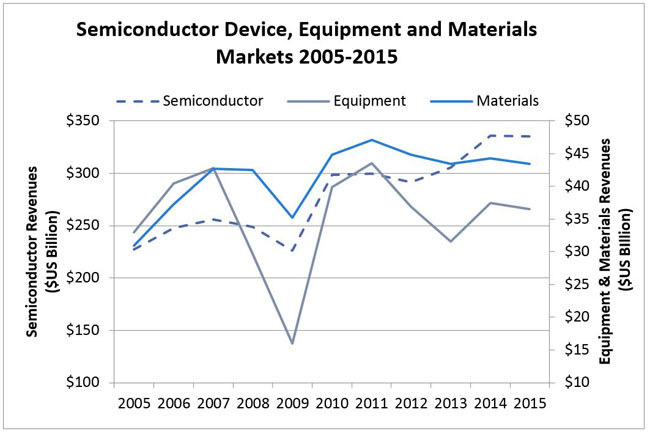
Semiconductor revenues were essentially flat in 2015 when compared to 2014 levels according to the World Semiconductor Trade Statistics (WSTS). The materials market mirrored the device market, while the equipment market contracted 3%. The semiconductor equipment market typically receives more attention than the materials market, however, and the materials market has been larger than the equipment for the past eight years.

Source: WSTS (semiconductor), SEMI/SEAJ (equipment), SEMI (materials)
Since 2013, the Japanese Yen has depreciated significantly. Given the importance of Japan-headquartered suppliers in the semiconductor supply chain, the weakening Yen has the effect of muting the growth of the global semiconductor supply chain when reported in US dollars (refer to Dan Tracy’s January 2016 article for more detail). The table (below) shows the impact of the weakened Yen on Semiconductor Equipment Association of Japan’s (SEAJ) book-to-bill data. SEMI reveals that if the data remained in Yen, the 2015 market for Japan-based suppliers would be up three percent. However, when the Yen are converted to dollars, the 2015 equipment market for Japan-based suppliers decreased 10 percent.
Semiconductor Equipment Billings of Japan-based Suppliers from SEAJ Book-to-Bill Report

Conversion Rates: 2013=~98¥, 2014=~106¥, 2015=~121¥
Looking at global trends, 2015 could be characterized by the year of discontinuity between shipments and revenues; semiconductor silicon shipment volumes increased three percent, marking the second consecutive record setting year for volume shipments (table below). By contrast, silicon revenues decreased six percent to total $7.2 billion, considerably off the market high of $12.1 billion set in 2007. The table also details the total semiconductor equipment market, which contracted 2 percent in 2015. Device revenues were flat, even though device shipments increased 3 percent. 2015 silicon revenues were adversely impacted by intense price down pressure exasperated by the weakened Yen.
Semiconductor Equipment
Worldwide sales of semiconductor manufacturing equipment totaled $36.5 billion in 2015, representing a year-over-year decrease of 2 percent and placing spending on par with 2012 levels. According to SEMI, equipment sales by major equipment category, only the Other Front-end segment (Other Front End includes Wafer Manufacturing, Mask/Reticle, and Fab Facilities equipment) increased 16 percent, while Wafer Processing equipment decreased 2 percent, and the Assembly and Packaging and Test equipment segments contracted 18 and 6 percent, respectively.
Taiwan retained its number one ranking last year despite TSMC slashing its CAPEX in 2015. Technology upgrades at DRAM makers were robust throughout the year as leading suppliers migrated to 20nm processes. The equipment market in South Korea displaced the North American market to claim second place at $7.5 billion. Aggressive spending by Flash Alliance, Micron, and Sony in Japan propelled the Japan market to the third position. The China market fell to fifth place, despite growing 12 percent last year. Strong investments by Samsung, SK Hynix, SMIC, and back-end companies continue to drive the equipment market in China. Equipment sales to Europe and Rest of world decreased 18 and 9 percent, respectively in 2015. Rest of World region aggregates Singapore, Malaysia, Philippines, other areas of Southeast Asia and smaller global markets.
Semiconductor Materials
SEMI reports that the global semiconductor materials market, which includes both fab and packaging materials, decreased 1 percent in 2015 totaling $43.4 billion. Looking at the materials market by wafer fab and packaging materials, the wafer fab materials segment decreased 1%, while the packaging materials segment declined 2%. However, if bonding wire were excluded from the packaging materials segment, the segment would have remained flat last year. The continuing transition to copper-based bonding wire from gold is negatively impacting overall packaging materials revenues.

Source: SEMI Materials Market Data Subscription
Taiwan maintained the top spot for the sixth year in a row, followed by South Korea, Japan, China, Rest of World, North America, and Europe (Figure above). Driving the materials market in Taiwan are advanced packaging operations and foundries. The South Korean materials market surpassed Japan’s for the first time last year, although Japan still claims a significant installed fab base (see Figure below) and has a tradition in domestic-based packaging. The materials market in China surpassed Rest of World (primarily SE Asia) for the first time due to the region’s emphasis on strengthening domestic semiconductor manufacturing. Approximately 70% of China’s total semiconductor materials market comes from packaging materials, according to SEMI.

Source: SEMI World Fab Forecast, February 2016
Outlook
Most analysts predict low single-digit growth for the semiconductor device market for 2016. Initial monthly data for silicon shipments, Mass Flow Controllers, leadframes, and semiconductor equipment are proving to be weak. In light of growth expectations for the device market, SEMI projects that the semiconductor materials market will increase 2 percent this year. Given current CapEx announcements, the outlook for semiconductor equipment is guardedly optimistic as well, with current projections of the equipment market showing modest growth this year, which would place the equipment market on par with 2014 spending levels.
2015 represented a pause in the industry with growth uneven across segments and regions. The weakened Yen and soft demand for semiconductors negatively impacted the equipment and materials segments. 2016 is promising to be another mixed year for the semiconductor supply chain with device, materials and equipment suppliers expecting modest increases for the year.
Portions of this article were derived from the SEMI Worldwide Semiconductor Equipment Market Statistics (WWSEMS), the Material Market Data Subscription (MMDS) and the World Fab Forecast database. These reports are essential business tools for any company keeping track of the semiconductor equipment and material market. Additional information regarding this report and other market research reports is available at www.semi.org/marketinfo.
Leave a Reply