Determining lift, drag, moment, heat flux, and pressure coefficients.

In the early years of space exploration, scientists and engineers dreamed of sending vehicles to Mars that could land on the planet’s surface and explore its terrain. However, one of their biggest challenges was safely reentering the Martian atmosphere. Many early attempts at Mars missions failed because the vehicles either burned up during re-entry or crashed onto the surface. However, as technology improved, scientists and engineers began to develop new techniques for re-entry that could withstand the extreme temperatures and pressures of the Martian atmosphere.
One breakthrough came in the 1970s with the Viking mission, which successfully landed two spacecraft on Mars. The vehicles used a heat shield to protect them during re-entry and a parachute system to slow their descent to the surface. These techniques became the foundation for future Mars missions. In the following decades, NASA and other space agencies refined their re-entry techniques, developing new heat shield materials, guidance systems, and landing technologies. These efforts culminated in the successful landing of the Mars rover Curiosity in 2012, which used a heat shield made of a material called Phenolic Impregnated Carbon Ablator (PICA). The PICA shield was designed to gradually erode as it heated up, which helped to dissipate the heat and protect the spacecraft and its instruments.
Reproducing the atmospheric conditions of planets like Mars is challenging. In the rarified regime, the assumptions for continuum mechanics break down at high Mach numbers and low densities, making it challenging to replicate re-entry velocity and temperature in wind tunnels. To successfully carry out a re-entry process, one must thoroughly understand aerodynamics, deceleration, and trajectory dynamics. Numerical methods and computer simulations play a crucial role in understanding the underlying physics of re-entry vehicles. So, engineers resort to these methods to estimate lift and drag coefficients.
Maximilian Maigler, a Ph.D. student at Universität der Bundeswehr München, conducted a study on vehicle re-entry into Mars atmosphere using Cadence Fidelity Pointwise to generate mesh for different test cases. His research employed numerical modeling, chemistry modeling, and computational fluid dynamics (CFD)/direct simulation Monte Carlo (DSMC) methods to determine the lift, drag, moment, heat flux, and pressure coefficients. His work provides valuable insights into the accuracy and limitations of numerical methods for vehicle re-entry modeling. Below are two case studies carried out during his work on vehicle re-entry trajectory.
One of the first and most sophisticated communication blackout research probes, RAM C-II, was launched in 1970 [1]. Many data were acquired specifically for the plasma field (ionized species) to study the effects of the plasma produced within and in close proximity to the bow shock on the vehicle, particularly radio attenuation measurements (RAM).

Fig. 1: Schematic of RAM C-II capsule [1].
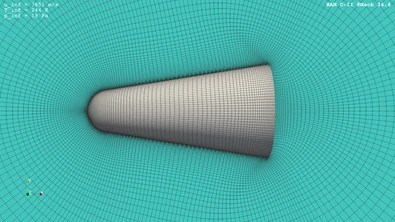
Fig. 2: Mesh generated for the capsule using Fidelity Pointwise.

Fig. 3: Contours of temperature (240 to 5,000 K).
In figure 3, the contours of temperature illustrate how the temperature rises to 5,000K in front of the vehicle, where the dissociation and ionization take place. This is responsible for the communication blackout, as ions and electrons are produced (see a mass fraction of electrons in the figure below), and electromagnetic waves cannot travel through the plasma and are absorbed.
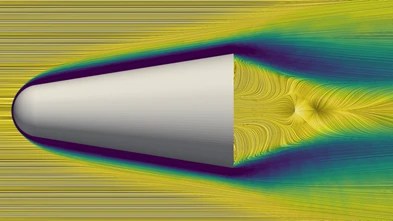
Fig. 4: Dissociation of O2 with streamlines around spacecraft.
Figure 4 illustrates the dissociation of O2 into atomic oxygen due to the extreme temperature in the bow shock.
The Viking 1 Lander, launched in 1976, is an ideal example for hypersonic reentry simulations. Its high angle of attack re-entry profile provides valuable insight for future re-entry missions. The Viking capsule experienced extreme conditions during re-entry, including low temperatures and pressure of 144 Kelvin and 5Pa. The capsule enters at an angle of 11 degrees, at an altitude of 44km, and at speeds of 23.1 Mach. The image on the left showcases the fully assembled Viking capsule, measuring 3.5m in diameter. The image on the right displays a cut section of the capsule, where the free stream approaches the capsule at the re-entry angle.

Fig. 5: Fully assembled Viking Capsule (left), cut section of the capsule (right).

Fig. 6: Pressure contours around the spacecraft.
In figure 6, the contours of pressure around the spacecraft illustrate how the bow shock in front of the vehicle heats the fluid with a rarefied wake near the rear side of the spacecraft. Then, the structure of so-called re-compression shocks behind the spacecraft occurs and further rarefies the flow downstream.

Fig. 7: Temperature contours around the spacecraft.
Figure 7 illustrates the contours of temperature at steady-state, showing how fluid compression converts its kinetic energy into heat and static pressure. The fluid has a lot of energy from the vehicle’s large free stream velocity, which dissipates into the different energy modes (translational, vibrational, and rotational).
In a nutshell, the use of numerical methods and computer simulations is crucial in predicting lift and drag coefficients for vehicle re-entry. The challenge of replicating atmospheric conditions on planets like Mars makes computational methods preferable. Results from simulations can be validated using flight data from prior missions. Employing chemistry models is also essential for precise simulation results.
Learn about the computation methodology, atmospheric chemistry modeling, and test cases for vehicle re-entry into the Mars atmosphere in the tech brief ‘Simulating Reentry Trajectories into the Mars Atmosphere‘.
Reference
 |
|
 |
 |
 |  |
 |  |
Leave a Reply