How to use native SystemVerilog constructs as metrics for verification closure.

Let’s say you have a block you need to verify. How do you know that the stimulus you are about to use is exhaustive enough and that you have covered the necessary scenarios/situations to prove it is working correctly? This is where functional coverage comes in. SystemVerilog’s functional coverage constructs allow you to quantify the completeness of your stimulus by recording the values that have occurred on your signals.
Consider an 8-bit address signal, paddr, and a 32-bit data signal, pwdata. Assigning a coverpoint to each signal will direct your simulator to track these signals during simulation and record the number of hits. For each coverpoint, bins can be created to organize the possible signal values into meaningful categories. Finally, a covergroup is used to encapsulate it all and is instantiated using the new() constructor. Associating the covergroup with a clock event is also a good way to trigger the coverage sampling.

Each covergroup contains options for configuration which allows customization. The example shown in Figure 1 uses options which determine the number of bins that are created for the pwdata signal and whether the covergroup is static across all instances or if there should be a separate covergroup for each instance in which the new() constructor is called. Other options allow you to change the weighting structure for your covergroups and specify the target coverage goal percentage and required number of hits for each bin; plus other options.
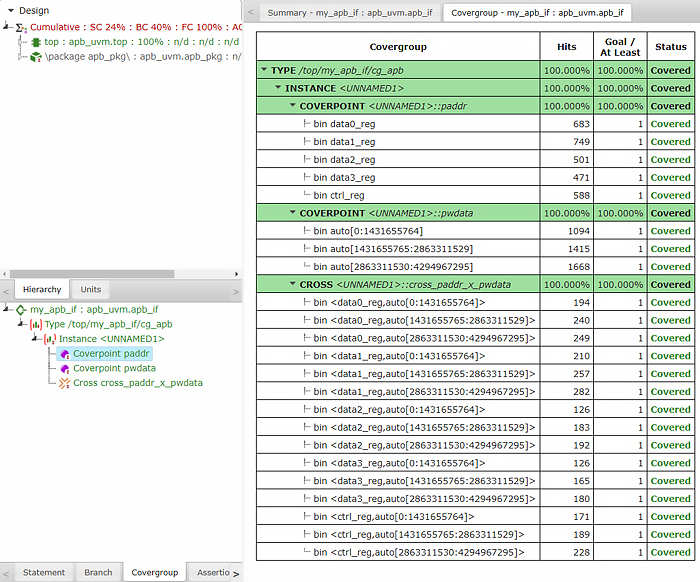
Cross coverage is also utilized here which is useful for answering the question: For each paddr bin, is there a sufficient variety of pwdata signals? As seen in the coverage report in Figure 2, the test produced a few hundred different data values for each paddr bin across pwdata’s entire 32-bit range. This should provide enough confidence that the stimulus was reasonably diverse. This can also help you decide if you should be constraining your stimulus more narrowly to achieve more substantial verification results.
After Riviera-PRO has finished running a simulation, a neatly organized HTML report with colored highlights can be generated to review the functional coverage. The report contains information on each covergroup, coverpoint, and the bins. Relevant coverage information such as the amount of hits, coverage percentage (goal), and coverage status are all displayed as a hierarchical tree. This report can become a convenient document shared with the verification team to measure verification progress.
 |
|
 |
 |
 |
 |
Leave a Reply