Time spent in debug on the rise; what needs to be fixed and why.

Verification engineers are spending an increased percentage of their time in debug — 44%, according to a recent survey by the Wilson Research Group.
There are a variety or reasons for this, including the fact that some SoCs are composed of hundreds of internally developed and externally purchased IP blocks and subsystems. New system architectures contribute to the mix, some of which are being developed to deal with an explosion of data. Add to that new packaging approaches, more complex interactions between different blocks and power domains, and an increasing emphasis on reliability for automotive and industrial applications, and the increased emphasis on debug begins to make sense.
But debug also needs to be smarter, with more selective data handling to reduce the heavy loads. The one thing everyone is sure about is that catching bugs earlier reduces the overall design cost and time, and the fix is less disruptive.
This is easier said than done, however. The simulation environment itself is often as complex, if not more so than the RTL itself, said Harry Foster, chief verification scientist at Mentor, a Siemens Business.
“It’s not unusual to see a UVM testbench with thousands of verification components as well as integrated verification IP,” Foster said. “This combined complexity is driving us to rethink the way we develop debugging tools. In order to do that, the appropriate tools and processes that lend themselves to weeding out bugs as soon as possible need to be considered in the planning process—right up front. We’ve got to think about debug as we’re planning this project. As Gen. Creighton Abrams once said, ‘When eating an elephant, take one bite at a time.’”
To properly perform debug today, high-performance, high-capacity debuggers are required to cope with huge designs, Foster said. “Debuggers have to be able to support multiple engines because for most SoCs today, at minimum you do simulation and emulation. So it’s critical to have a debugging environment that works across those. Also, the debugger must provide full synchronization views between the analyzed waveforms combined with the source code, as a quick link back and forth, and to be able to step through all the waveforms and the source code.”
Next, due to widespread Universal Verification Methodology (UVM) adoption, debuggers must be UVM-aware. “This includes understanding SystemVerilog classes, and the ability to debug at the transaction level, given that contemporary testbenches are transaction-based,” he said. “On top of that, debuggers must be power-aware. Going forward, if you look at the way we design and verify IP and subsystems, it’s pretty mature across the industry. We all basically do very similar processes, steps and tools in that. The real challenge has moved to the system level. For example, the ability to view performance issues from a system perspective is a huge challenge, and you’ve got to be able to view from a system perspective the transaction duration, overlapping transaction performance, and many other views are required to determine a performance issue.”
This a problem because traditional debuggers looked at source code and waveforms, and which isn’t the best way to find performance issues. In fact, quite often the tests pass and engineers assume everything is good even though there is a problem.
“So it doesn’t even identify the performance issue,” Foster said. “Other ways are needed to mine the simulation traces or the emulator runs so events can be pulled out. And then you can ask intelligent questions like, ‘Why didn’t this transaction complete until X number of cycles later?’ That’s where the problem has moved. It’s moved to the system level, and this is why performance analysis in particular has become so important.”

Fig. 1: Non-trivial bug escapes into production in FPGA designs. Source: Wilson Research Group/Mentor, a Siemens Business
Other emerging technologies include post-silicon debug, given that SoCs consist of a lot of integrated third-party IP. Frequently, third-party IP has its own debugging solutions in place, but not all of those debugging solutions talk to each other. A new standard effort, called the Open SoC Debug (OSD) specification, is trying to address this issue. Instead of having proprietary debugging solutions that often are delivered with third-party IP, the goal is to provide open solutions that could simplify the integration process. This specification could help promote innovation in terms of new post-silicon debugging capabilities.
In the near term, three important areas need to be addressed, all of which are new paradigms in debug, according to Larry Melling, product management director in the System & Verification Group of Cadence. “The first is increased interest, since the portable stimulus standard came out, in what can be called system-scenario debug. This is the idea of being able to put together complex workloads, lots of concurrent activities, and then when things fail, determining how to debug those. The second one is related to this, which is continued growth of using software as a driver for test and verification. With software comes some different debug requirements, such as programmer views of what’s going on in the test and in the system. The third important area to address for debug is driven by functional safety—fault simulation and mutation coverage debug, such that as I fault a system and get those results, if those results are not what I anticipated, how do I figure out how to correct that? And what needs to happen to correct it?”
Technology is under development in all of these areas.
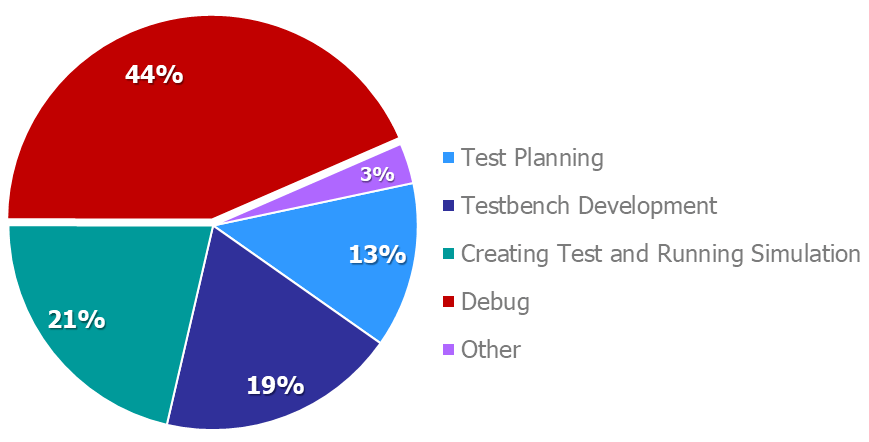
Fig. 2: Where ASIC verification engineers spend their time. Source: Wilson Research Group/Mentor
Data pressures
As any verification engineer can attest, verification tasks generate a tremendous amount of data. But it isn’t always clear what is the best way to leverage that data.
“Be forgiving on how complex debug is, taking into account how much data we generate,” said Frank Schirrmeister, senior group director for product management and marketing for emulation, FPGA-based prototyping and hardware/software enablement at Cadence. “Everything is getting massively parallel. Massively parallel simulations are generating oodles of data. Lots of parallel emulators are generating oodles of data. So debug overall needs to be smarter. Where 10 years ago you were able to just collect everything, store it away and then go back to it, it’s becoming much more agile from a debug perspective to be able to hone in.”
In fact, so much data is being generated that it all can’t be stored and then processed in a reasonable timeframe.
“Engineering teams need to be able to be much smarter about the verification and when to trigger things,” Schirrmeister said. “For example, we have a graph where one axis is visibility and the other is the time to waveforms. We have what we call the full vision set, where you basically get all the signals in the design and you can look at them. It creates a lot of data that is good for engineers who don’t have the knowledge about the overall design, the IP, the protocols. So they basically have to store everything and then find a way through it. But it makes it very difficult from a data collection perspective.”
There is also an ability to do partial full vision for areas of interest, so the data can be collected at that certain time. Because the engineers generally know where to look within the design, they only collect that set of data. This allows them to be more agile in the data collection process.
Melling agreed. “A lot is going on in terms of massive data generation, but there’s also a lot of use of technology on the debug side to try to help manage things like the ability to just trace the essential signals and reconstruct, on the fly, expanding large databases, on demand, in areas of interest as opposed to always having to expand the entire database.”
Underlying all of this activity, and what is driving verification teams to these new areas and new approaches is the continuous push to shift left, he noted. “You’re trying to get everything figured out, tested and verified pre-silicon, and hopefully have a much smoother time to manufacturing and production of the solution.”
For ASIC suppliers, debug traditionally has meant chip bring-up in the target environment and trouble-shooting possible circuit or process issues, said Mike Gianfagna, vice president of marketing at eSilicon. “While this is still true, the scope of this activity is now much broader. There is a lot of code running in a typical ASIC today, so that variable adds another level of complexity to the process. IP typically is sourced from multiple vendors, so there is a lot of detective work and coordination needed to isolate potential issues in this arena. Also, the functionality of the part is no longer influenced only by the fab process. Complex 2.5D packaging introduces more supply chain partners and more sources of variability.”
Debug challenges for 2019
Debug can be broken down into three fundamental steps—triggering a bug, detecting that bug, and providing the user with enough information to find and fix the source of the bug.
“While simulation has made significant progress on all three fronts, constrained-random testbenches and portable stimulus test case generation do a far better job of exercising a design than hand-written test vectors,” said Sasa Stamenkovic, senior field application engineer at OneSpin Solutions. “This increases the chances of setting up the right scenario to trigger the bug. Both approaches generate self-checking tests, so these checks plus user-written assertions greatly increase the likelihood of detection. Waveform viewers and other debug aids have become somewhat cleverer about what they display and how they display it. However, simulation provides no guarantees, and so major challenges remain.”
Stamenkovic contends that formal verification offers a superior solution to all three aspects of debug because it triggers bugs by directly analyzing each assertion check. If there is a related bug, it will be found.
“This exhaustive analysis has no counterpart in simulation or emulation,” he said. “The formal engine considers all possible stimuli to trigger the unintended design functionality and detect the bug, based on the given assertion. Formal tools can automatically generate a simulation test (counterexample) showing the bug, allowing debug in a familiar environment. Since formal analysis knows exactly how the bug was triggered and which signals are relevant, the counter example is shorter and more focused than native simulation tests. This makes the final stage of debug faster and easier.”
Finally, while verification in general has been significantly improved, debug remains a signal-level activity using a GUI-based solution, so it is hardly surprising that debug today represents a substantial proportion of total verification time, said Dave Kelf, chief marketing officer at Breker Verification Systems. “Debug needs to be considered as an integral part of the entire verification process, particularly for system-level test. Building debug hooks directly into the testbench provides feedback mechanisms into the log file to pinpoint root causes. For system-level debug, dumping signal-level databases greatly slows simulation and emulation. Testbench-based debug rules out issues and narrows down problems areas that might then be checked using simulation.”
The kinds of bugs that occur at the system level include, for example, complex coherency problems that are hard to duplicate and track down. Next-generation debug systems will use big data techniques and comparisons of multiple verification runs. AI-based systems correlating large scale simulation data will help narrow down these kinds of issues efficiently, he said.
Conclusion
A couple of major challenges remain, and going forward they will become more important. The first involves debug of neural networks.
“For a lot of the architectures that are being promoted for machine learning and deep learning, no really good debugging strategies exist,” said Mentor’s Foster. “That’s something that’s going to require a fair amount of research, and it’s important because of the way these systems are architected, they can be extremely difficult to figure out where the problem is.”
The second is beyond the chip. “As we go to the Internet of Everything, now we’ve got interesting, very high level debugging challenges that have emerged, particularly in automotive where there is 5G coming in for cars, talking to smart cities, as well as talking to other cars. Debugging that whole world in the Internet of Everything is going to open up new opportunities for research.”
That should keep verification engineers busy for quite some time.

 |
|
 |
 |
 |
 |
Leave a Reply