The optimization of solder paste vision detection settings is crucial for reducing clip lifting defects.

In the semiconductor industry, the outsourced semiconductor assembly and test (OSAT) sector plays a pivotal role in the global technology landscape. As the backbone of electronic device manufacturing, OSAT companies are entrusted with the critical task of assembly, testing, and packaging of devices. Maintaining quality in OSAT operations is of paramount importance, as it directly impacts the performance, reliability, and lifespan of the end products [1].
This paper aims to address a significant quality-related issue in the clip attach process in semiconductor manufacturing. The problem is the occurrence of clip lifting due to insufficient solder paste under the clip during the assembly process. This issue leads to an increased lot rejection rate and poses substantial challenges to manufacturing efficiency and product quality. Tackling this problem used the Six Sigma methodology, a data-driven approach renowned for its effectiveness in improving assembly processes and reducing defects [2]. Specifically, it implemented the Define, Measure, Analyze, Improve, and Control (DMAIC) approach. The DMAIC methodology is particularly relevant to this study as it provides a structured framework for problem solving and process improvement.
Reducing the occurrence of clip lifting decreases rework costs, enhances customer satisfaction, and bolsters confidence for future business. The delivery of quality products to customers is not just a business imperative but also a commitment to upholding customers’ trust and confidence [3]. This study intends to illuminate the path towards precision and accuracy in clip attach vision systems, thereby contributing to the broader goal of quality enhancement in the semiconductor industry.
The DMAIC approach originated from Motorola in the 1980s and was later popularized by companies like General Electric [4]. DMAIC provides a systematic sequence of steps aimed at identifying issues, optimizing processes, and sustaining improvements over time [5].
The five steps of DMAIC are as follows [6]:
The case study is about providing a sustainable solution to reduce the failure rate of devices due to clip lifted issues. This failure is observed from X-ray analysis of IR (Reverse Current) failed devices. The scope of the project is to reduce and eliminate continuous occurrence of clip lifted by using the Six Sigma DMAIC approach.
In the define phase, a detailed study was conducted based on the type of rejections found during X-ray analysis and separate clip lifted defects based on the defect mode. Using the Pareto chart analysis in Figure 1, the highest defect mode detected from the X-ray analysis was the clip lifted mode with 26.9% of the overall defects.

Fig. 1: Pareto chart analysis of X-ray defects.
This clip lifted defect mode was categorized as critical. This defect can only be detected from X-ray analysis and cannot be sorted during functional testing. Based on the analysis illustrated in Figure 2, clip lifted defects were compared to good units, and it was noted that all the clip lifted devices had an abnormality of solder on the die. The solder on die was less in volume and stretched upwards.

Fig. 2: Good vs clip lifted unit comparison.
To further study the clip lifted defect mode occurrence, a project team was organized as shown in Table 1. The project team was carefully selected based on their roles and responsibilities for brainstorming and decision-making processes during the measure and analyzing phases.
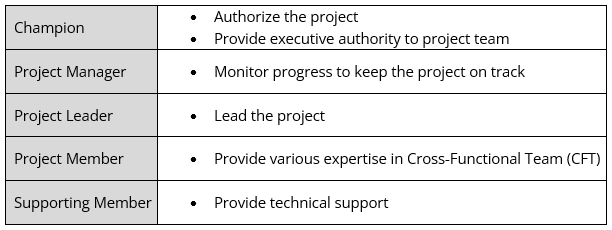
Table 1: Project team roles and responsibilities.
During the measure phase, various types of methods and tools were used to identify and quantify the clip lifted defect. This phase involves collecting data about the process and the current performance level.
The initial step in addressing the clip lifted defect involved a thorough examination of the product’s process flow. This examination entailed listing the entire process and then narrowing down the focus to specific areas for problem solving. As depicted in Figure 3, the clip attach process was identified as the primary suspect since after the clip bonder, the process will undergo curing where the flux from the solder will be removed, and clip will be strongly bonded to the die surface. Hence, the suspected process must occur before curing and after the die attach process.

Fig. 3: Process flow.
Based on process flow, process mapping had been drafted for the clip attach process as shown in Table 2. Basically, the clip attach process consists of three sub processes: dispense solder on die, clip pick-up, and clip mounting. These processes were studied based on key process input variables (KPIV) to determine the key process output variables (KPOV) which will be used to construct a cause-and-effect matrix table.
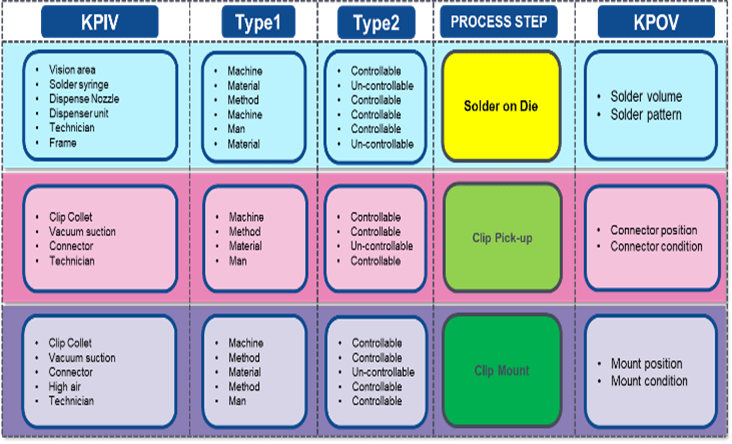
Table 2: Process mapping of clip attach process.
For the next step in the study, a cause-and-effect diagram, also known as a fishbone or Ishikawa diagram, was constructed [7]. This diagram is a visual tool used in problem-solving to identify, explore, and display the possible causes of a specific problem or quality issue [7]. Using the cause-and-effect diagram, the possible causes of clip lift occurrences were analyzed in terms of 4M: Man, Method, Material and Machine as shown in Figure 4. The output from this diagram has been used for further study during root cause analysis.

Fig. 4: Fishbone diagram.
A cause-and-effect matrix, also known as an X-Y diagram or correlation matrix, was used to determine the KPIVs based on the KPOVs during process mapping, as shown in Table 3. It reveals the correlation between process input variables and the outputs, which were helpful for the root cause analysis. The highest total score was 220 for both “vision detection setting” and “solder syringe,” indicating these are critical inputs according to this matrix.
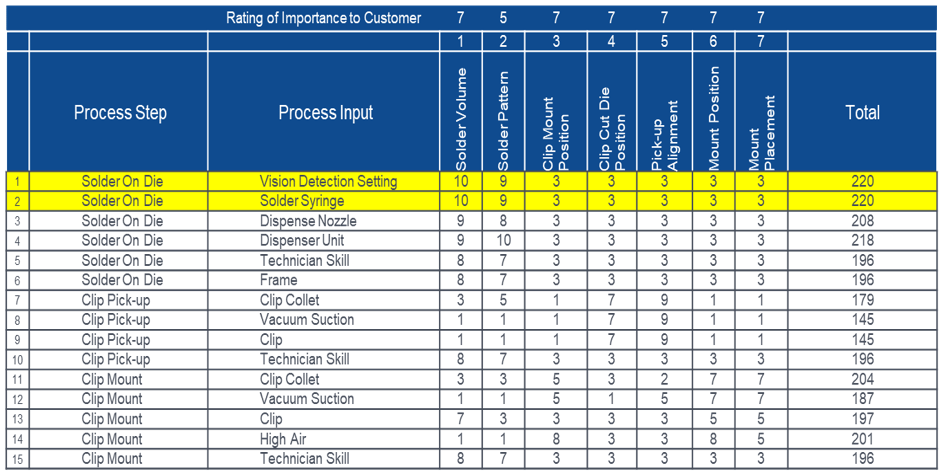
Table 3: Cause-and-effect matrix.
FMEA analysis reveals several critical areas in the solder on die and clip mount processes that require immediate attention to enhance process reliability and product quality. Notably, the failure modes associated with Vision Detection Setting and Solder Dispense Pressure have the highest risk priority numbers (RPN) of 336, as shown in Table 4. Specifically, the issues with camera brightness and insufficient solder volume due to inadequate auto feedback mechanisms are causing significant problems, such as clip lifting. These high RPN areas are critical and must be prioritized for corrective actions. Improving the detection systems to accurately gauge die surface conditions and ensuring proper control over solder volume are vital steps in mitigating these high-severity risks.
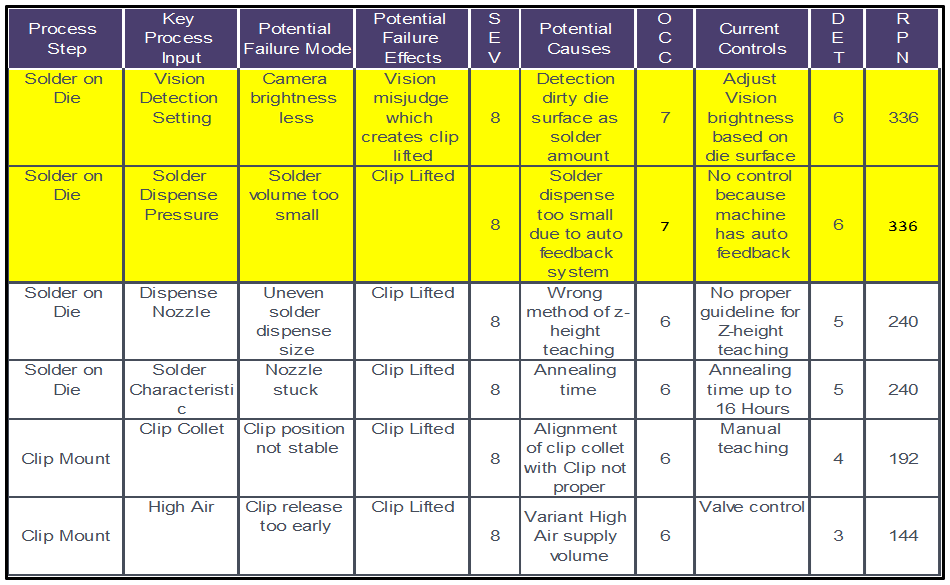
Table 4: Clip lifting FMEA analysis.
In the analysis phase of addressing the clip lifted defect, the focus shifted to leveraging statistical methods to deepen the understanding of the relationship between vision detection settings and the occurrence of clip lifting. This phase was built upon the comprehensive groundwork laid out in the measure phase, where various tools such as process mapping, cause and effect analysis, and failure mode effective analysis were employed to identify critical factors influencing product quality.
The primary objective is to determine whether adjusting these settings can significantly affect the incidence of clip lifting, thereby informing potential process improvements aimed at enhancing product reliability and quality. To initiate the analysis, wafers with dark surface characteristics were carefully selected for simulation to mimic real-world conditions. Each simulation run consisted of three different lots. Throughout the tests, the vision system’s brightness levels were systematically varied between 40, 60, and 80 lux settings, reflecting different operational configurations that might impact detection sensitivity and accuracy. Following each simulation run, the occurrence of clip lifting was meticulously recorded and quantified by conducting X-ray inspection of final test devices.
The statistical tool employed for this analysis is the chi-square test. This test is chosen for its suitability in analyzing categorical data to determine whether there is a significant association between vision detection settings and clip lifting occurrences [8]. Specifically, the chi-square test will assess whether observed frequencies of clip lifting differ significantly from expected frequencies under different brightness levels (40, 60, and 80 lux).
The null (HO) and alternative (HA) hypotheses formulated for this test are as follows:
The chi-square test indicates statistics of 9.367 with 2 degrees of freedom and a corresponding p-value of 0.009, as shown in Figure 5. Since the p-value is below the conventional significance level of 0.05, there is sufficient evidence to reject the null hypothesis that vision detection setting has no significant effect on clip lifting.
Therefore, the alternative hypothesis was accepted, which suggests that variations in brightness levels do influence the likelihood of clip lifting defects during the assembly process.

Fig. 5: Chi-square test result.
The optimization of solder paste vision detection settings is crucial for reducing clip lifting defects during the assembly process. The solder paste vision detection system uses an image checker to determine pixels in the captured images based on threshold setting. The threshold setting usually will be set if any volume of solder paste that falls below the lower limit or above the upper limit setting is flagged as a defect. Once the threshold setting is established, the vision detection system utilizes it to analyze the images it captures. Each pixel in the image corresponds to a specific area on the surface of the die. The system analyzes the value of each pixel, which represents the volume of the solder paste, and compares it to the threshold. If the pixel’s value deviates from the threshold, the system flags that area as a potential defect.
To understand and improve the current vision detection system, multiple simulations were conducted based on different vision brightness levels (40, 60, and 80 lux). This light brightness level was chosen based on the minimum and maximum allowed pixel specification. Initially, a dark surfaced die without any solder paste on it was checked for pixel reading under the 20-lux brightness level, the current routine lot setting. The baseline pixel reading was recorded as 444, which indicates a misjudgment of the current vision detection setting as detecting the presence of solder paste. Subsequent tests conducted on similar dark surfaced die based on brightness levels of 40, 60, and 80 lux revealed varying pixel reading outputs such as 290, 83 and 1, as shown in Table 5.
Based on simulation, the 40-lux setting exhibited a reduction in pixel rate to 290 from the initial 444, indicating improvement of the ability to detect the die surface. However, this setting must be rejected since it still indicates empty die surface as present of solder paste. The most substantial refinement in pixel readings was observed at brightness level of 60 lux, where the rate dropped notably to 83 pixels. This reduction signifies enhanced precision in identifying the die surface. Conversely, a vision brightness level of 80 lux resulted in an almost negligible pixel count (1 pixel). An overly bright setting could potentially be misjudged as excess or insufficient solder on the die surface. Therefore, the 80-lux brightness level must be rejected, since it poses risks of erroneous assessments.
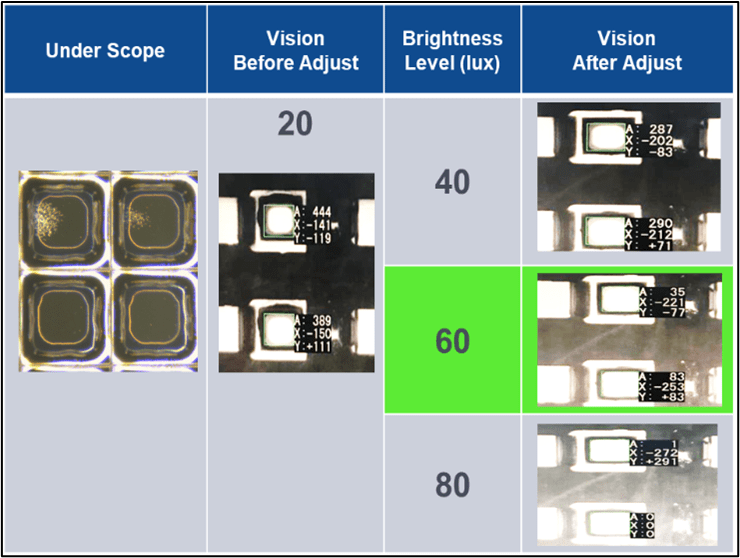
Table 5: Simulation result of different brightness levels.
Simulations concluded that a vision brightness level of 60 lux emerged as the optimal setting for routine production lots to reduce the clip lifted defect mode occurrence. Its balanced reduction in pixel readings signifies an optimal compromise between sensitivity and accuracy of die surface detection for solder paste volume inspection.
The control phase was aimed at ensuring the sustained effectiveness of recent improvements derived from optimized vision detection settings. Comprehensive education and briefing sessions were conducted across the production line to equip the employees with the knowledge and understanding necessary to implement and uphold the new vision settings consistently.
The effectiveness of the improvements, monitored and tracked using performance metrics as shown in Figure 6, shows a significant and sustained reduction in clip lifted defects after the implementation of the optimized vision settings. Since the start of the project, where the historical average defect rate was recorded at 5.6%, the defect rate progressively decreased to 1.26%, subsequently dropping further to 0.96%, 0.49%, 0.38%, and ultimately achieving a defect rate of 0% from month to month. These measurable improvements underscore the efficacy of the new vision detection parameters in enhancing product reliability and meeting stringent quality standards by dispensing the correct volume of solder paste on the die surface for clip attachment.

Fig. 6: Performance metrics chart.
This project successfully addressed the issue of clip lifting defects using the Six Sigma DMAIC methodology. It began by defining the problem of rising defect rates detected through X-ray analysis. The Measure phase involved detailed data collection and analysis to understand the root causes, focusing on process mapping and failure mode effective analysis. Analytical tools, including cause and effect diagrams and chi-square testing in the Analyze phase, confirmed the impact of vision detection settings on defect occurrence. In the Improvement phase, optimal vision settings were identified to reduce clip lifting, leading to a significant decrease in defect rates. The Control phase ensured sustained improvement through monitoring and education. Achieving and consistently maintaining defect rates below the targeted baseline of 2.6% demonstrates the control phase’s success in surpassing initial quality improvement objectives. Overall, the project exemplified systematic problem solving and process optimization to enhance product quality and reliability.
 |
|
 |
|
 |
 |
 | |
 |
 |
Leave a Reply